2.4.1. Ultrasound Field
2.4.1.1. Demo 1: CircSrc_SWE_Demo1.m
Plot the 2D linear ultrasound field.
2.4.1.1.1. Examples
See Fig. 2.4.1, where the source settings are as follows.
prf = SrcProfile('name', 'uniform');
src = CircSrc('radius', .1, 'prf', prf, 'freq', 40e3);
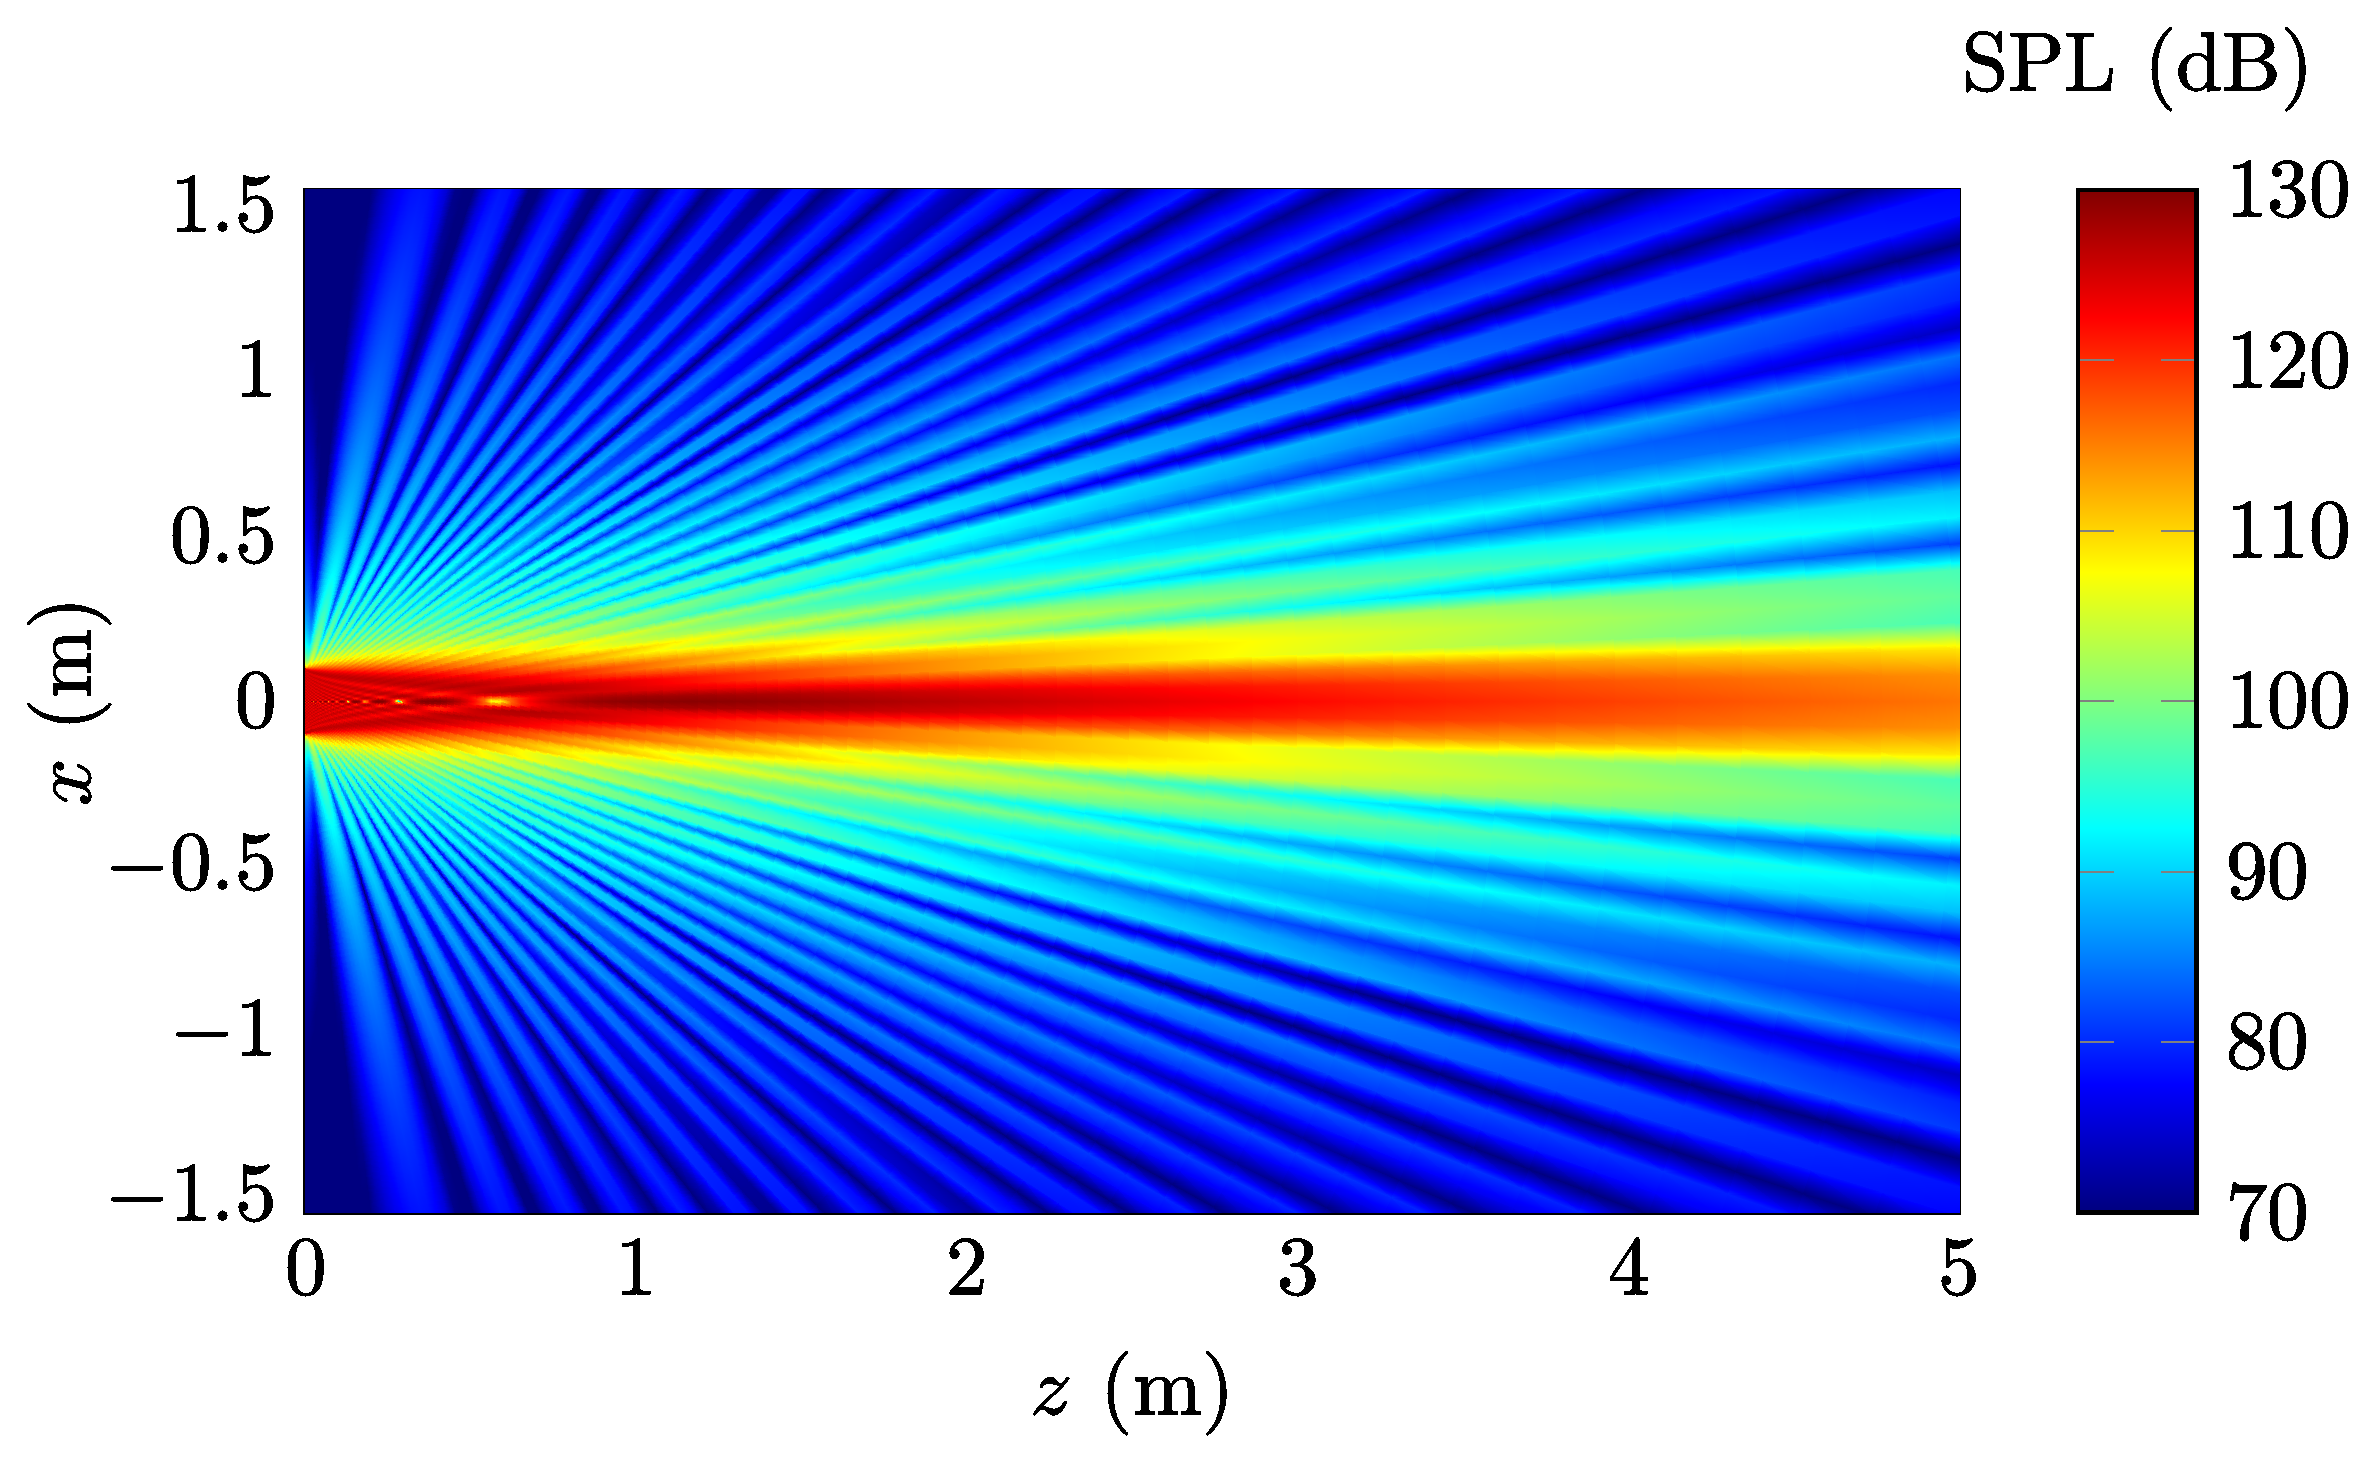
Fig. 2.4.1 Ultrasound field at 40 kHz generated by a circular source with a radius of 10 cm. The source profile is uniform (piston source). The on-surface pressure amplitude \(p_0 = 50\, \mathrm{Pa}\ (125\,\mathrm{dB})\).
2.4.1.2. Demo 2: CircSrc_SWE_Demo2.m
Calculate the directivity using the SWE.